This material is provided for general informational and educational purposes only. It is not investment advice or a recommendation.
What a volatility number actually measures
Volatility describes the dispersion of returns over a specified period. Historical, or realized, volatility is usually calculated from past price changes. Implied volatility is derived from option prices and reflects the volatility input consistent with those market prices under a chosen model. Both are commonly annualized, allowing different horizons to be compared on a standardized scale.
Annualization can make a precise-looking number appear more informative than it is. The result depends on the sampling frequency, lookback window, weighting method and assumptions about how returns scale through time. A short window responds quickly to recent moves but can be noisy. A long window is more stable but can obscure a regime change.
Volatility is also direction-neutral. A sequence of large gains can generate the same statistical estimate as a sequence of large losses. For questions involving capital impairment, funding pressure or behavioral response, the direction and order of returns may matter as much as their average magnitude.
Realized and implied volatility answer different questions
Realized volatility records what happened over a historical interval. Implied volatility embeds the price of option protection, future uncertainty, supply and demand for options, interest rates, dividends or carry and model conventions. It is therefore not a pure consensus prediction of subsequent realized volatility.
The difference between implied and subsequently realized volatility is sometimes described as a volatility risk premium, but even that label requires care. Option sellers may require compensation for bearing asymmetric losses, jumps, uncertain hedging costs and liquidity risk. Option buyers may pay for protection because its value is greatest in adverse states, not because they expect the implied figure to be matched exactly.
Horizon matters. One-week implied volatility can be shaped by a scheduled event, while longer-dated options may reflect broader macroeconomic or policy uncertainty. Comparing tenors can reveal how uncertainty is distributed through time, but the curve can also be affected by positioning, structured-product flows or localized demand for hedges.
The distribution matters beyond its average width
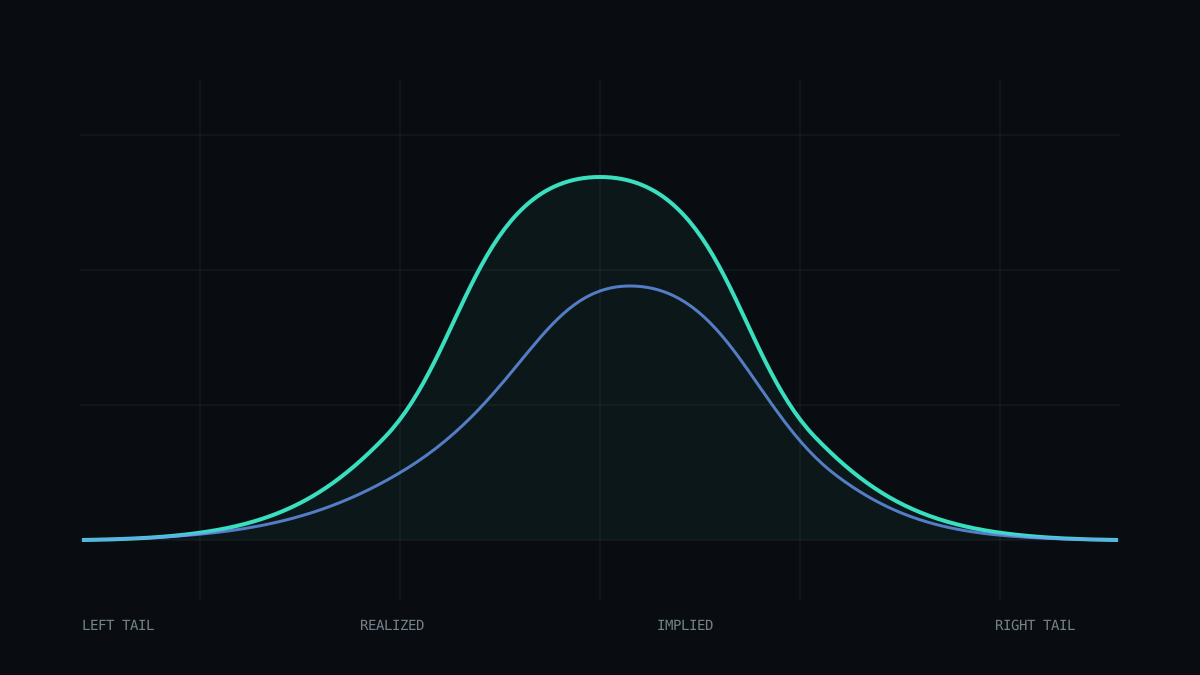
Standard volatility compresses the return distribution into one statistic. It does not describe skew—the imbalance between upside and downside outcomes—or kurtosis, which reflects the prevalence of extreme observations relative to a normal distribution. Two assets with identical headline volatility can therefore have very different downside behavior.
Options make some of these differences visible. A volatility smile or skew shows that options with different strike prices trade at different implied volatilities. Strong demand for downside protection can raise the implied volatility of lower-strike options relative to at-the-money contracts. In other markets, concerns about sharp upside moves may shape the surface differently.
Jumps create a further distinction. Continuous small moves and occasional discontinuous gaps can produce similar realized volatility over a sample, yet they have different implications for execution and hedging. A position that can be adjusted during gradual movement may be difficult to manage through an overnight gap or a market halt.
Correlation is part of the distribution too. The volatility of a portfolio depends not only on the volatility of each component but also on how they move together. If correlations rise during stress, portfolio-level variability can increase even when each asset's standalone volatility changes only modestly.
Path, liquidity and clustering shape experienced risk
Volatility tends to cluster: large moves are often followed by large moves, and quiet periods by quiet periods. This persistence is one reason static estimates can lag the market. A low long-term average may coexist with rapidly increasing short-term variability, while an elevated backward-looking measure can remain high after current conditions have calmed.
The path of returns affects drawdowns and recovery. A steady decline, a sudden gap and repeated reversals can yield comparable volatility but create different funding, hedging and decision pressures. Sequence also matters for portfolios experiencing cash flows, leverage adjustments or path-dependent option exposures.
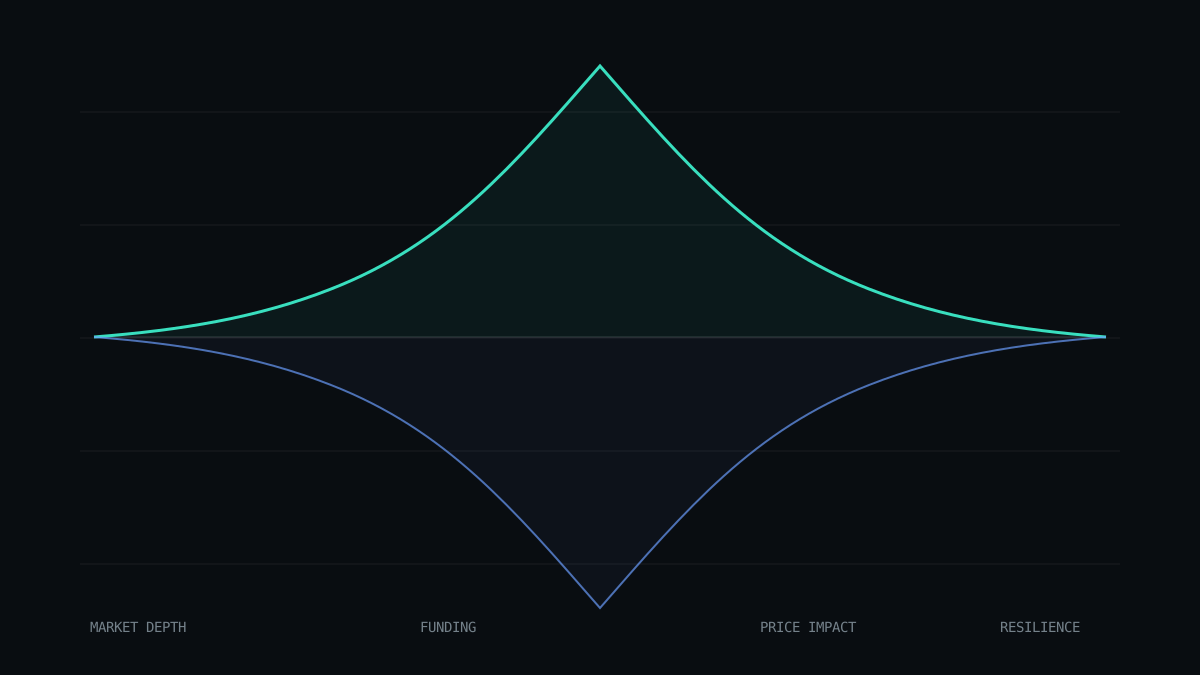
Liquidity and volatility can reinforce one another. Wider spreads and thinner order books increase price impact, creating larger observed moves. Larger moves can lead dealers and market participants to reduce risk capacity, which may weaken liquidity further. Headline volatility may therefore reflect both changing beliefs about value and changing conditions for transferring risk.
Market conventions complicate cross-asset comparisons. Bond volatility can be expressed in yield or price terms; currency and commodity options have their own quoting practices; equity volatility is often discussed through broad indices. A number that looks similar across markets may represent different economic sensitivities.
Building a fuller picture of uncertainty
A more complete description begins with the definition: realized or implied, observation window, sampling frequency, tenor and annualization convention. It then adds the shape of the distribution, including downside and upside behavior, the frequency of jumps and the stability of correlations. Drawdowns and liquidity conditions help connect the statistic to market experience.
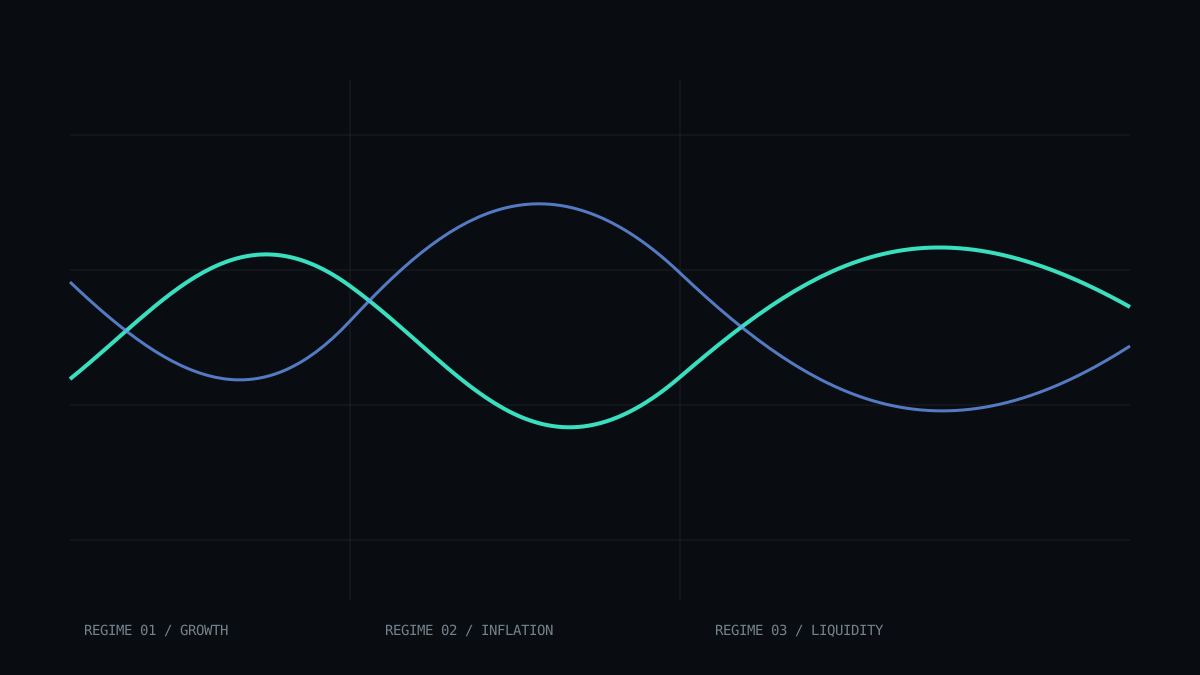
Event and regime context are equally important. Scheduled announcements can concentrate implied risk in a narrow horizon. A policy transition can shift the entire volatility term structure. Positioning or hedging flows can move option prices even when views about underlying fundamentals are mixed. No single explanation should be inferred from the level of volatility alone.
Headline figures remain useful summaries, especially for comparison and communication. Their limitation is not that they are wrong, but that they are incomplete. Volatility becomes more informative when treated as a multidimensional description of uncertainty rather than a solitary gauge of how risky a market is.